

Line graphs are perfect when you’re illustrating a subject’s change over time. In addition, line charts can show crucial intersections between two lines. Beginners won’t need to practice drawing lines and using technical software platforms. Now, they can utilize easy-to-use and beginner-friendly online graph maker apps.


Moreover, line charts are simple yet incredibly informative. For example, a business performance graph can show an expense and profit line chart. CEOs can instantly know if their new product performed well at a given time by finding an intersection between two lines in the chart.
We’ve narrowed down the best beginner-friendly line chart makers you can use. The platforms in this list contain both paid and free apps. Plus, you won’t need to have prior graph-making knowledge to use them.
1. Venngage: Create a Line Graph in Seconds
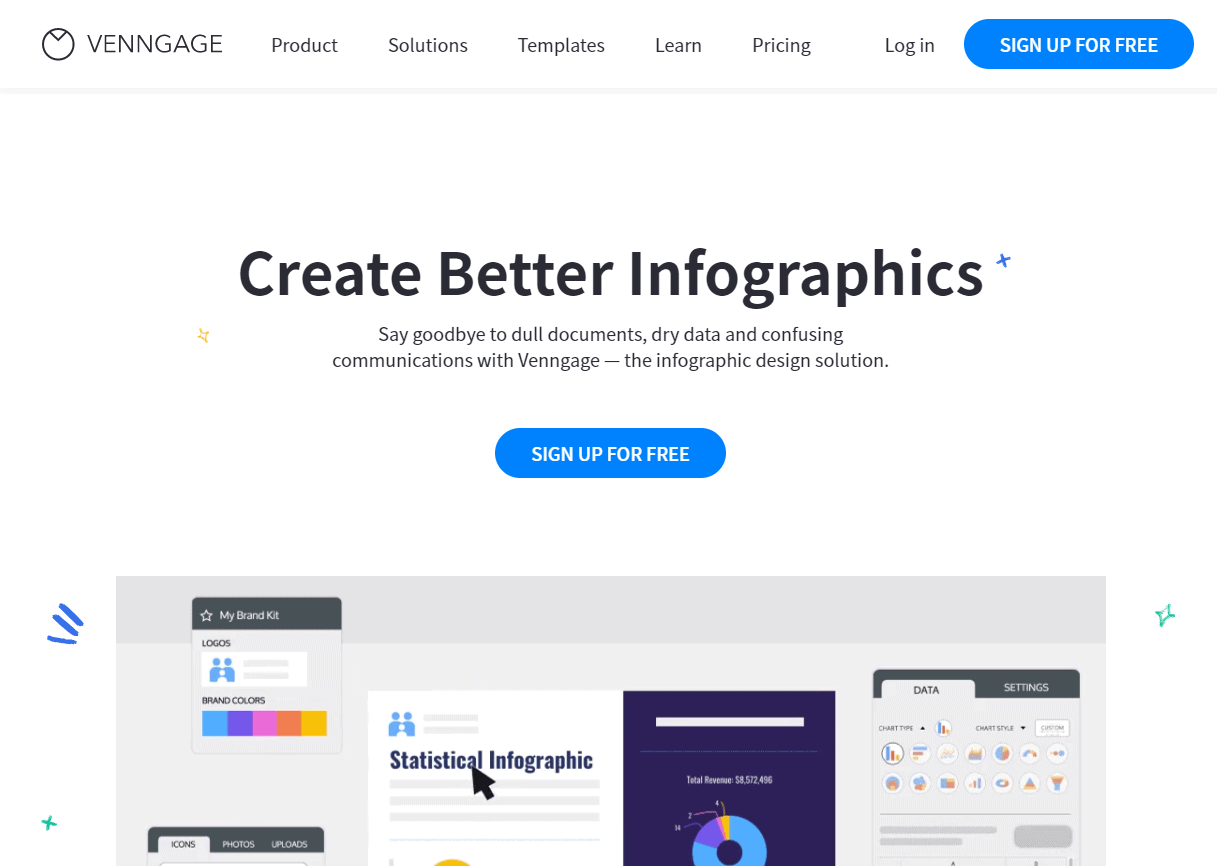

You can quickly jump into Venngage and create a line chart because of its clean and straightforward interface. Many businesses have found its simple chart-making facilities time-saving because it requires the least effort possible to make a graph.
You can use Venngage’s free personal account to try out its features. Users can quickly create a line graph using the following steps:
- Log into your Venngage Account
- Go To My Designs
- Find a Suitable Line Chart Template
- Place Your Data
Venngage has more than a thousand available chart and graphics templates you can use for any report. You can fully edit the chart’s most minor details to suit your needs.
However, Venngage’s free-of-charge accounts have limited options. These include image uploading restrictions and chart usage terms. Alternatively, the paid versions offer advanced features and lift many of the free account’s limitations.
2. Visme: A User-Friendly Chart Maker
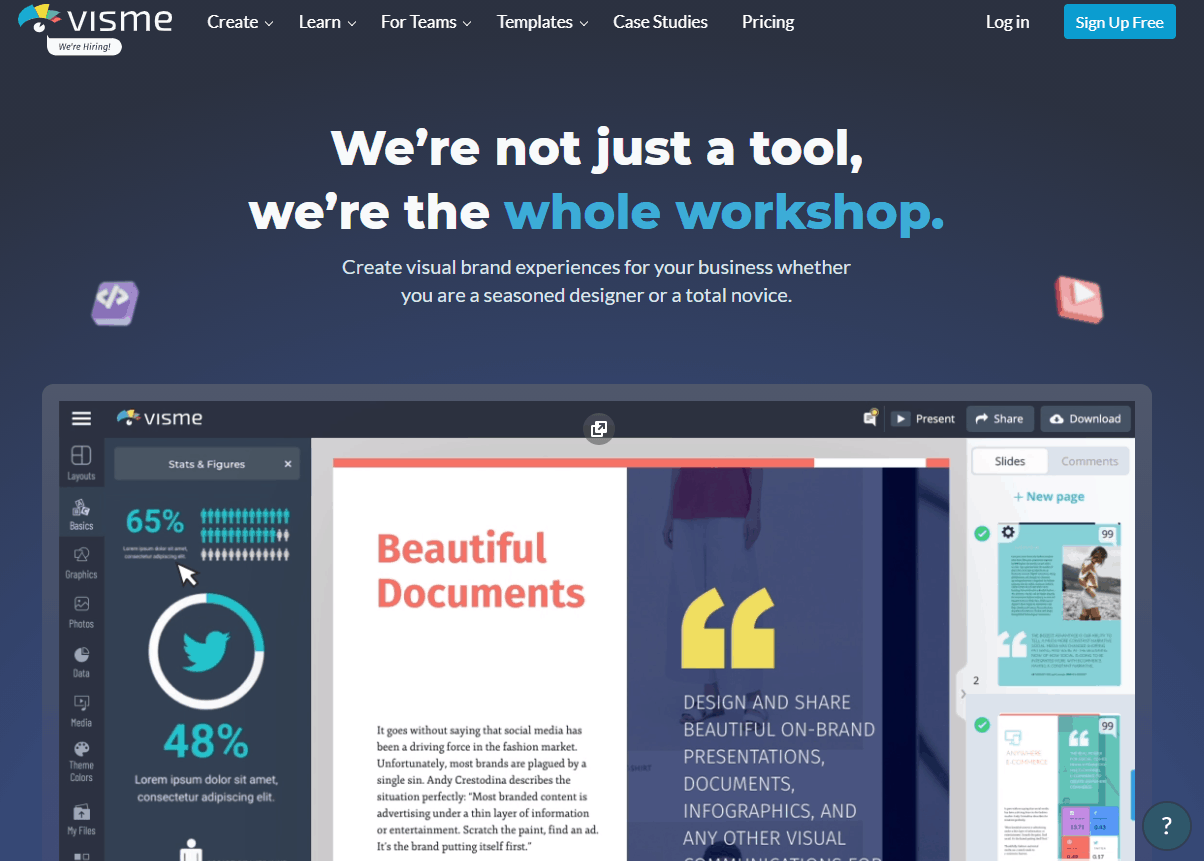

This free-to-use graph-making app is second to Venngage because it offers the same accessibility and flexibility. Visme has a user-friendly and straightforward chart-making interface that beginners can use to make a line graph within minutes.
Top reviews about Visme talk about its wide variety of different presentation-ready graphs.
You can quickly get started on making your line chart with these simple steps:
- Log into your Visme account
- Select a template or blank canvas
- Click the Data icon
- Choose the Line Chart icon
- Click the Graph Engine’s Settings tab
- Customize the line colors, fonts, and backgrounds
Visme has download limitations for free account users. Therefore, you can only use your free account to explore Visme’s many templates and features. Paid accounts give you much more line chart templates and image downloads.
3. RapidTables: Enter Data and Get a Line Plot Graph in Seconds
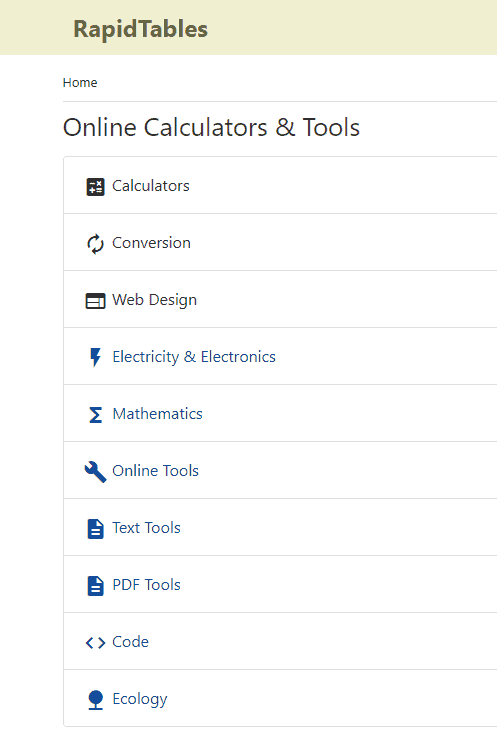

This online line graph app is entirely free to use. Many beginners can quickly create a line graph with RapidTables’ direct-to-the-point and user-friendly interface. Plus, users get a whole set of technical calculation tools they can conveniently access with a browser.
You can use these steps to get started making your line chart:
- Give your line graph a title
- Label your X-axis
- Label your Y-axis
- Choose whether your X-axis display labels, values, or range
- Input labels, values, or range in the corresponding placeholder
- Choose the number of lines the chart will display
- Place the lines’ values and separate each point with space
- Label your lines
- Click Draw
RapidTables’ suite of chart-making tools and calculators has limited visual customization options. The app only has one pre-selected line chart template. However, RapidTables is perfect for beginners looking for a simple-to-use charting app.
4. Canva: Featuring Various Types of Line Graph Aesthetics
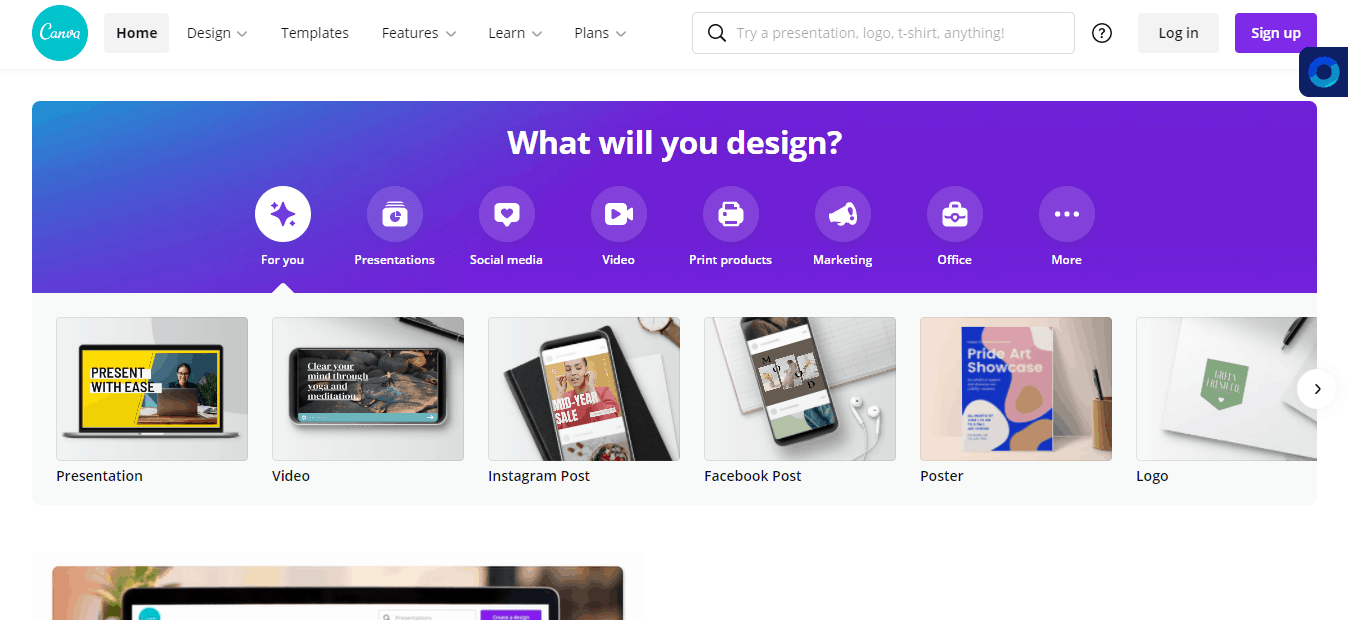

You might know Canva as an excellent quick graphic design tool. However, you can make a visually appealing line chart using Canva. Plus, it has hundreds of line graph templates that you can readily customize for your needs.
You can easily create your first line graph with Canva with the following steps:
- Log into your Canva account
- Select Charts under the Elements tab
- Choose the Line Graph icon
- Select Data
- Enter your data
- Customize your line colors and fonts
Canva works like Venngage and Visme. Its free-to-use personal account allows users to explore its wide variety of templates. The paid version gives you advanced features and the most extensive selection of customizable line graph templates.
5. Google Sheets: Everyone’s Simple Chart Maker

Google Charts isn’t the most straightforward line graph maker for beginners. On the other hand, you can quickly create a line graph using Google Sheets. Here’s a simple instruction list to make a quick line graph:
- Go to Google Sheets
- Click Insert
- Choose Chart
- Select Line Chart
- Use your sheet to customize labels and data
- Choose the data range the line chart will display on your line chart
- Customize line colors and fonts
Google Sheets’ chart feature is similar to RapidTables and involves a whole Sheet document. Users cannot modify their Google Sheet line graph’s aesthetics. Google Sheets’ chart feature is perfect for beginners because of its simple steps.
Get Started On Your Line Charts In No Time
You might find some of the apps on this list might offer more for aesthetics and customization. Alternatively, some of the platforms focus on simplicity and ease.
We can guarantee that you can create excellent and non-misleading graphs within minutes by using any item on this list.